Corn market — Simplify price analysis
It’s going to be a year of price doldrums for corn, says analyst Richard Brock.
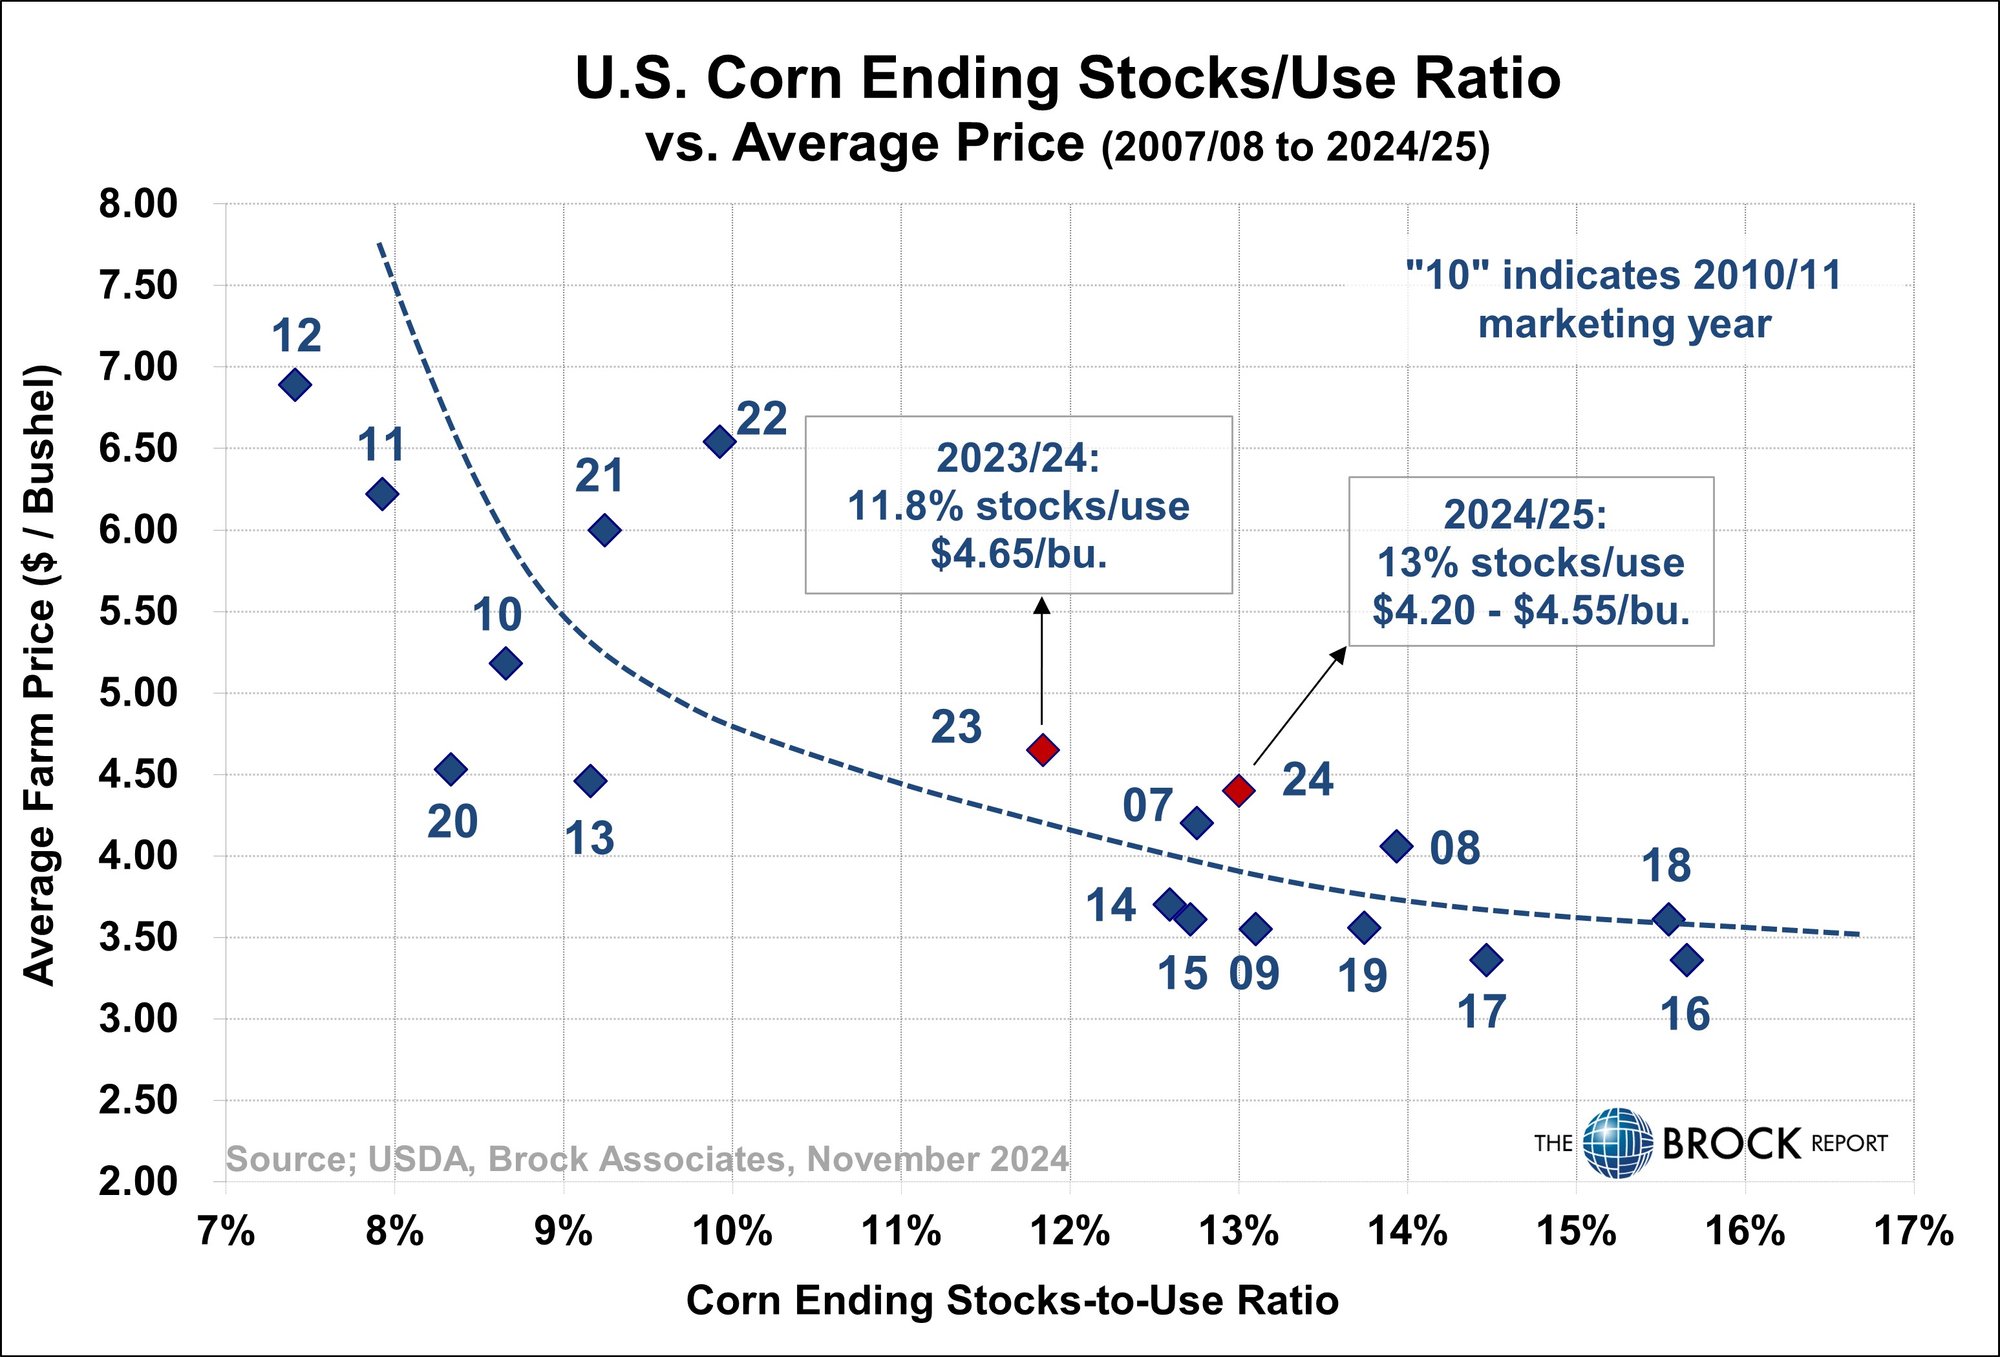
By Richard Brock, Brock AssociatesNo two markets are the same. All are impacted by a different set of fundamentals. My all-time favorite has always been corn. The U.S. is the largest producer in the world which makes it influenced by fewer fundamental factors. Concentrate on one number to forecast the price of corn and that is the stocks to usage ratio at year end. The market is “voting” on what will be left over at year end.
This year our estimate is 13.0%. A simple analysis of the scatter diagram shown below and to the left would estimate the expected nationwide average price at roughly $4.35 per bushel. If we compare this to the central Illinois average price, which as this is being written is at about $4.26, we would have to conclude that the market is well priced right now and may continue to chop up and down in a relatively narrow sideways range.
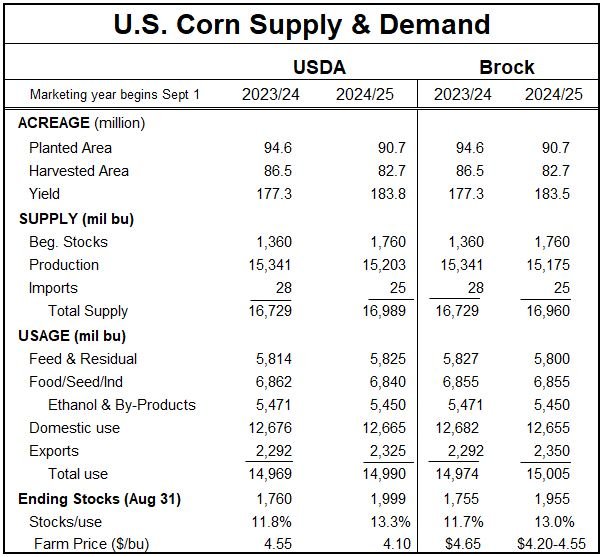
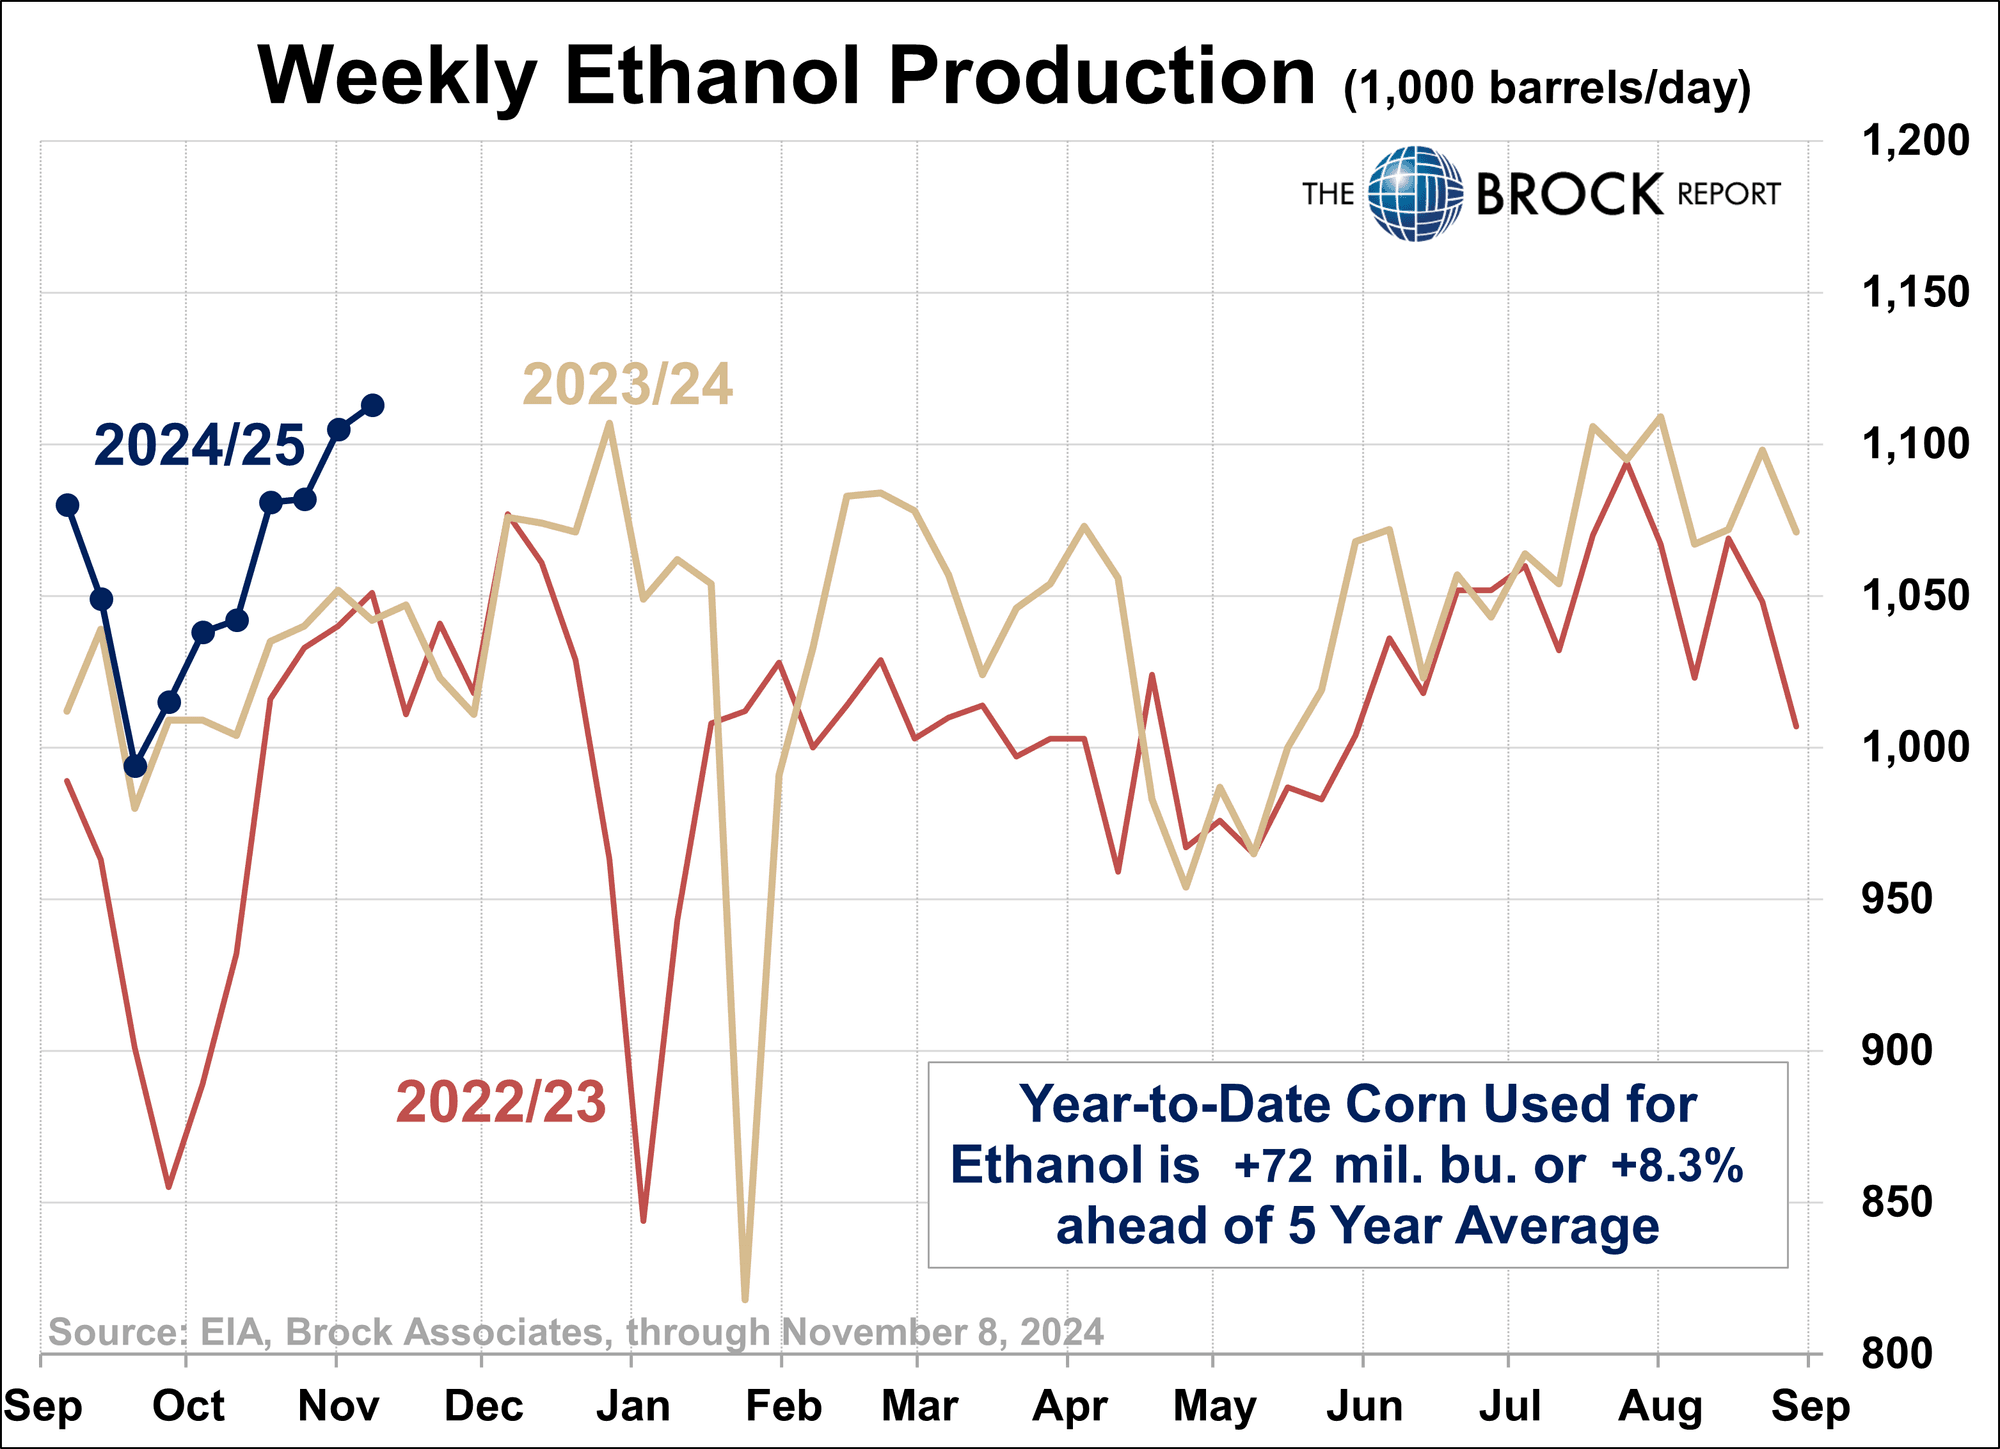
In looking at the balance sheet on the next page, feed and residual usage for this year we have estimated at 5.8 billion bushels compared to the old crop at 5.827. That won’t change much. Ethanol estimated usage of 5.45 billion bushels, which is also relatively stagnant, but off to a great start as shown in the graph. Very little change from year to year, maybe this year will be different. But new plants are not being built and very few, if any, are under expansion. The number is solid and not likely to go down but also not likely to increase much.
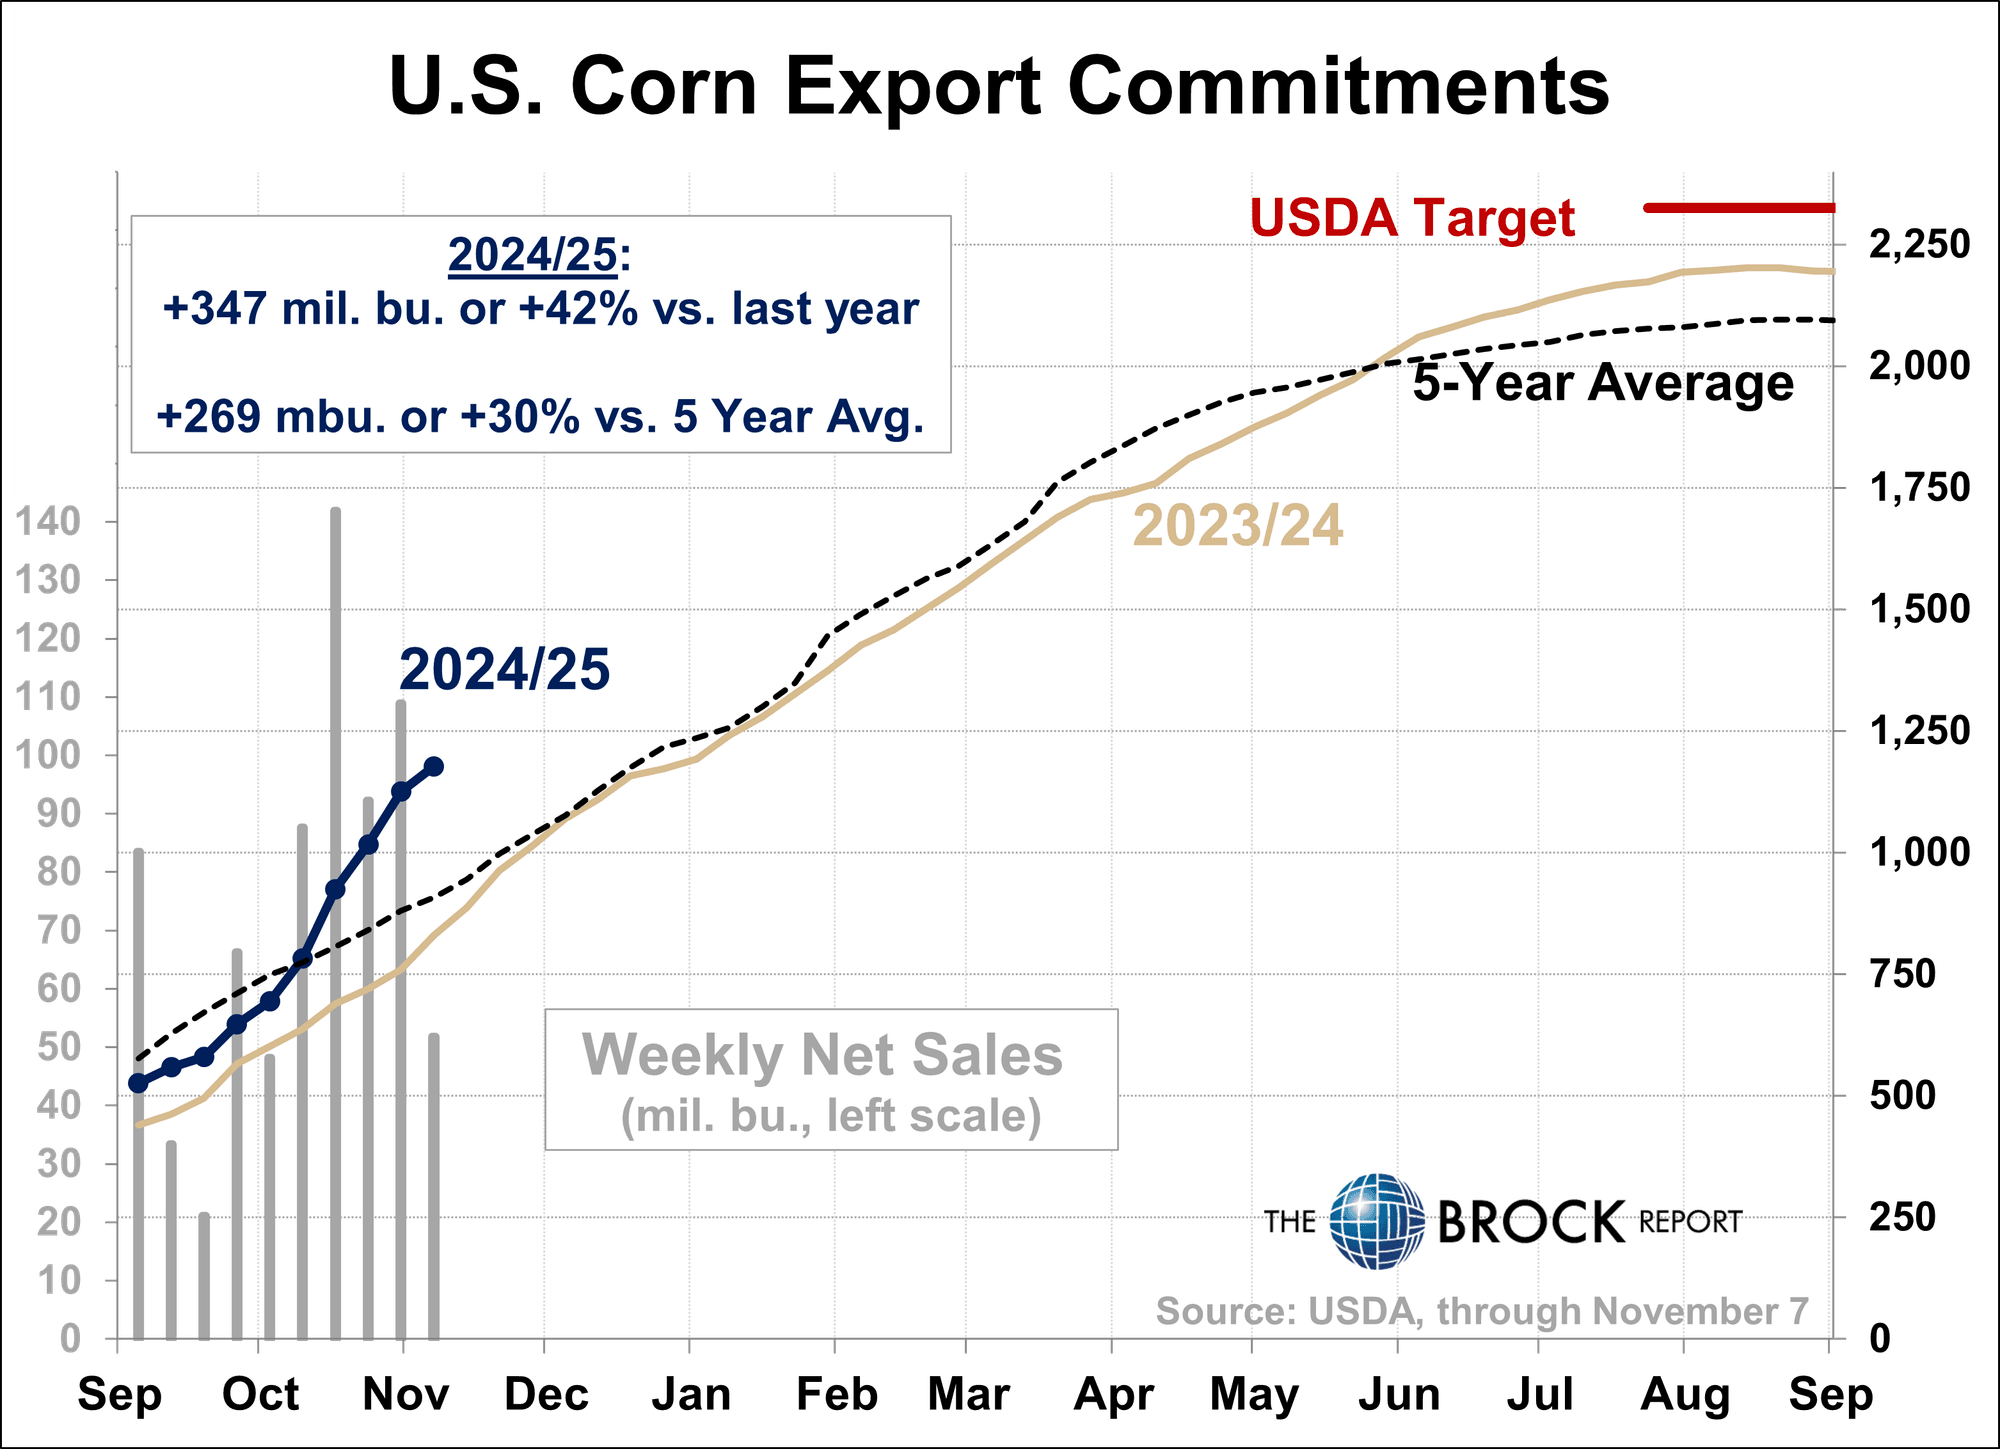
The demand number in question this year is exports. Countries buy more corn from the United States when corn is cheap than when it’s really high. Exports as of mid-November are running substantially higher than they were a year ago. Our estimate is 2.35 billion bushels compared to the old crop at 2.29. It’s very likely we could be low on the estimate of 2.35. With 42 weeks left in the marketing year, export commitments are already more than 50% of the USDA Target.
What Does It All Mean?
In 2021 and 2022 the corn stocks to usage ratio ran 9% to 10%. To get to 10% stocks/usage, total usage would have to increase by 455 million bushels. That’s not at all possible.
For one line economists who only concentrate on one fundamental, in order to get a major bull market going one has to visualize a substantial usage increase or a significant planted acreage cut this coming spring. Neither are very likely. In looking at the monthly corn chart note that from 2014 to 2020 corn prices were stuck in a sideways trading range of about $1.00 per bushel from $3.00 to $4.30. Is that possible again? Certainly is. Our only difference would be to estimate that the range will be $3.50 to $4.60. It’s going to be a year of price doldrums.
Richard Brock is Chairman of Brock Holding Company which is comprised of Brock Associates, an agricultural marketing advisory service and publisher of The Brock Report, established in 1980 and Brock Investor Services (futures and options brokers).